Processes. Ports. Evidence.

PerformanceDaddy: A slow Mac.
A clearer picture.

See what is running behind the scenes on your Mac. Inspect background apps and helpers, find the process holding a port, watch RAM and local coding agents, and record evidence while a slowdown is happening.

Local preview · no public download yet
macOS 14+ · Native Mac app

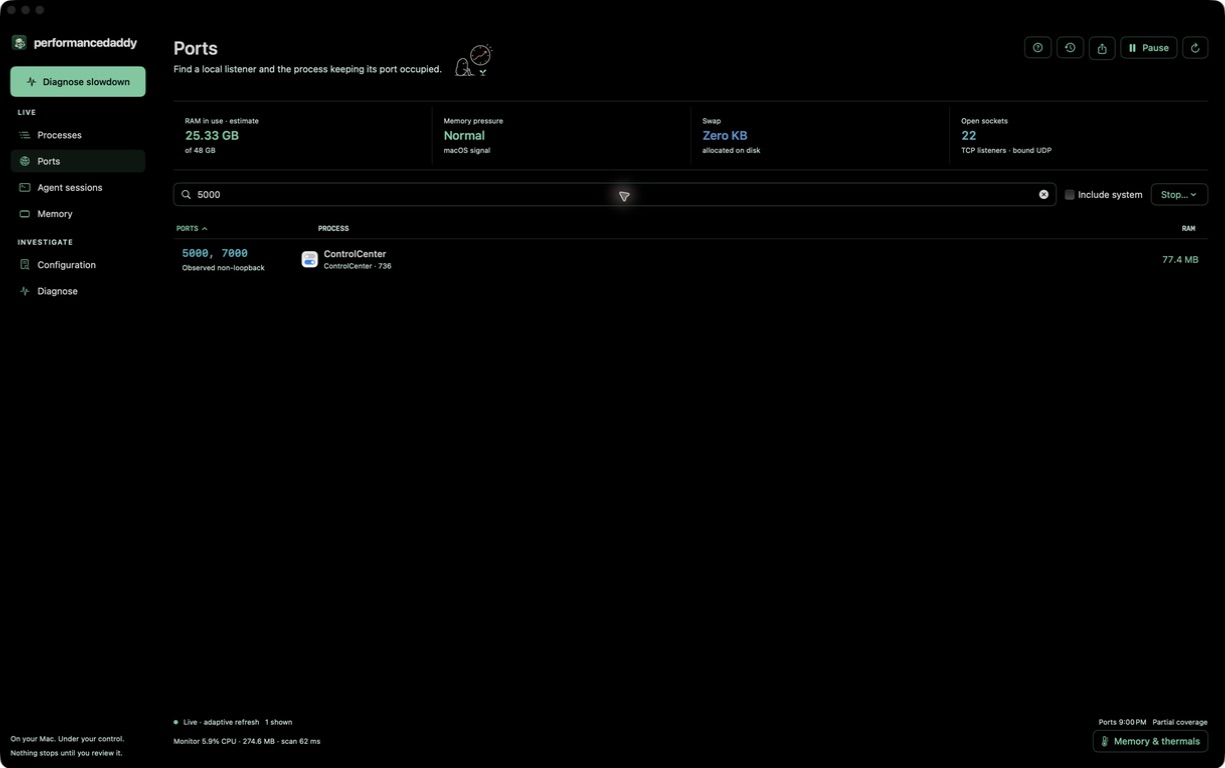
PerformanceDaddy Ports view searching port 5000 and identifying ControlCenter as its owner
View full-size screenshot

A real local capture: search a port, see its owner and resident RAM. Socket visibility depends on macOS permissions.

Ports & processesFind who owns the port.

DiagnosisRecord the slow moment.

A busy process is a clue. It is not the whole story.

Start with what you can measure.

A port can be occupied while CPU is quiet. Allocated swap does not prove active paging. PerformanceDaddy puts the observations, their limits and the next check together.

A daily Mac workbench

Find it. Inspect it. Decide.

Move from the symptom you can see to the process and resource evidence behind it. Stopping a process always starts with a review.

Ports & processes

Find who owns the port.

Search listeners by port number or process. Sort CPU and RAM, inspect process duration and recognized local agent families, then review exact targets before a normal or force stop. No remote port scanning or cloud agent sessions.

A real port search with process ownership and RAM evidence
View full-size screenshot

Diagnosis

Record the slow moment.

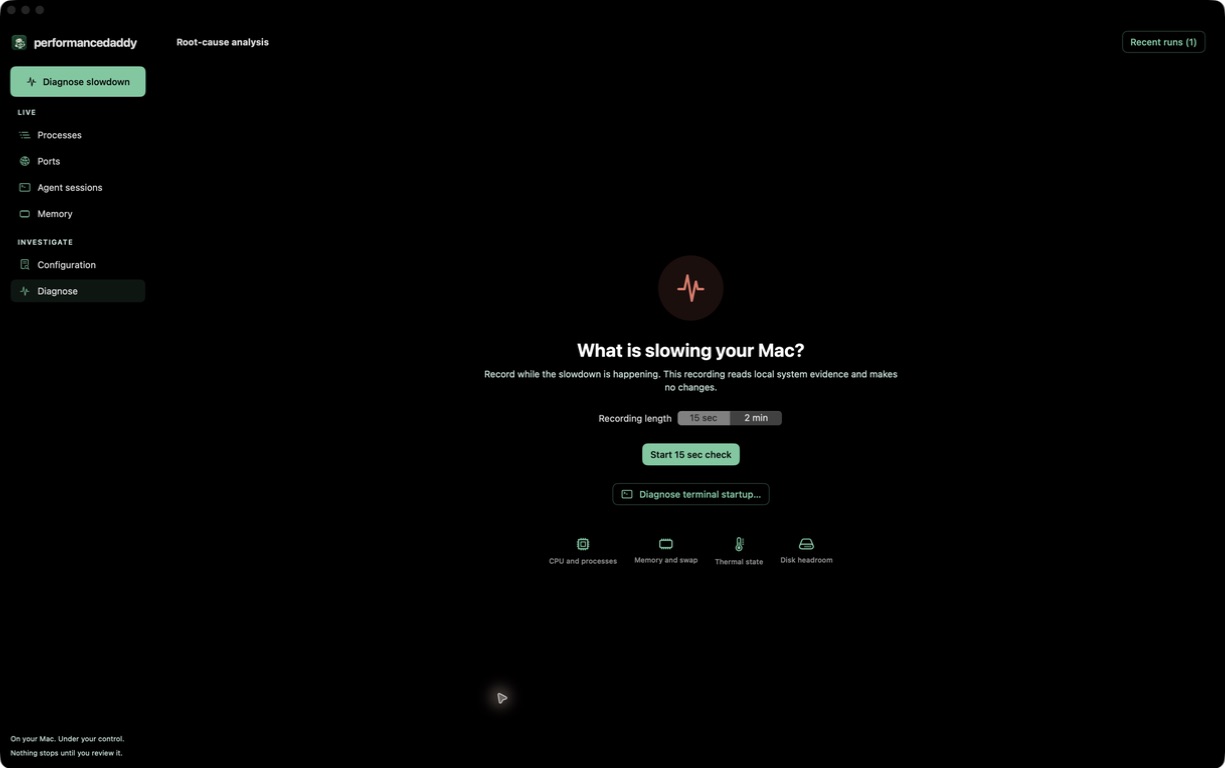
Capture CPU work, memory headroom, active swap-out, thermal state and disk capacity for 15 seconds or two minutes. Every run gets an evidence assessment and a next check, including when the measured signals cannot explain the delay.

Diagnostic recording setup with explicit duration and measured domains
View full-size screenshot

An honest fit

For a Mac full of moving parts.

A fit Developers running local servers and coding agents who want visible ports, understandable processes, RAM evidence and deliberate stop controls.

Not a fit Automatic optimization, cloud-session monitoring, remote network scanning, fan control or a promise to identify every root cause.

Local investigation

Your work is not the payload.

Process inspection does not collect command arguments, environment variables or agent conversations. Configuration inventory reads bounded file metadata, not contents. A separate terminal experiment runs your startup scripts only after explicit consent.

Read the plain-language privacy policy

A few honest answers.

Can I download it now?

Not yet. This is a preview of the working local Mac app, not a public release. No App Store or TestFlight availability is claimed.

Can it kill a process?

Yes, after review. Normal and force stops are separate choices, guarded by process identity and user restrictions. Stopping a process can interrupt work or lose unsaved data.

What about apps running in the background?

Inspect visible background processes and app helpers alongside foreground workloads. Compare their CPU and resident RAM, see how long a process has been running, and inspect available identity and startup metadata before deciding what to stop. Background does not mean unnecessary: macOS and your apps rely on many of these helpers.

Why did something come back after I stopped it?

An app, login item or service manager may launch another process. PerformanceDaddy shows matching launch-configuration clues and watches for matching executables after stops requested through the app. A match is not proof of an automatic restart or its cause. This history stays in memory for up to 24 hours and clears when you quit; the app does not disable startup items for you.

Which agents does it recognize?

Local metadata recognition covers Codex, Claude, Devin, Hermes, Aider, Gemini CLI, OpenCode and Cursor CLI. It cannot identify every wrapped launch or tell whether a conversation is active.

Does every report prove the root cause?

No. Reports separate observed signals, thresholds not met and missing evidence. CPU activity is not proof of why a task was slow. Network latency, blocked threads, GPU activity and disk latency are not measured by the standard recording.

Can it read fan speed or temperature?

The app reports macOS thermal state and available power evidence. Raw fan RPM, temperature and fan controls are not implemented.

“Nothing stops until you review it.”

The PerformanceDaddy action rule

Observe by default. Make consequential actions explicit.

Understand the load.
Choose the next move.

See release status